Deal Reporting
- Overview
- Using the Deal Reporting page
- Prerequisite
- Accessing the Reporting page
- Deal Reporting Workflow
Overview
The Reporting Dashboard allows you to view detailed metrics related to deal performance. It keeps track of key performance indicators (KPIs), such as Spend/Revenue, eCPM, Impressions, and Win Rate. It includes filter options to generate customized reports based on specific criteria such as the Advertiser, DSP, Deal Name or Deal ID, Trafficker/Ad ops, Sales Person, and Date Range.
Using the Deal Reporting Page
The Reporting Dashboard provides the following key functions:
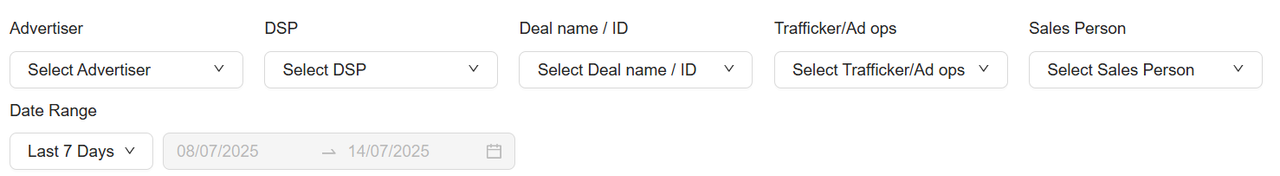
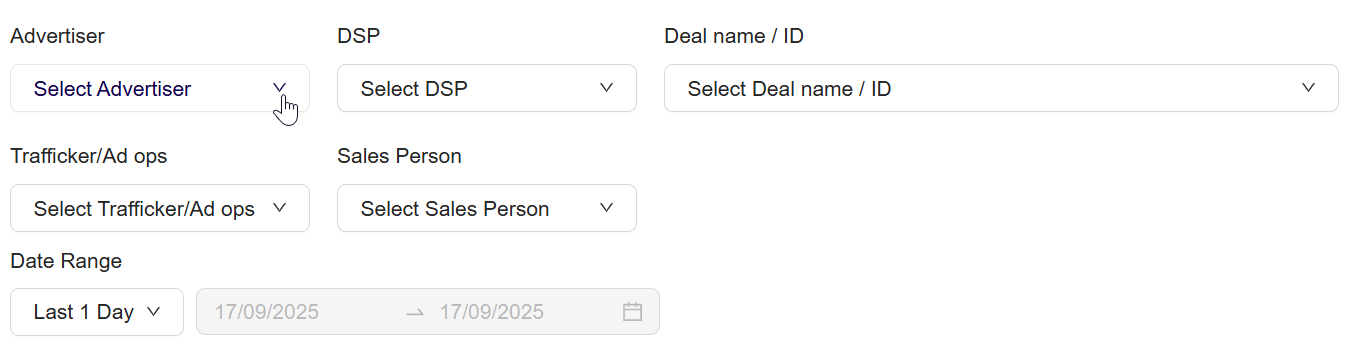
Filter
This section enables you to customize your reports by applying various filters.
-
Advertiser: Choose the advertiser whose data you want to view.
-
DSP: Select the Demand-Side Platform (DSP) associated with your deal.
-
Deal Name/ID: Filter reports by deal name or deal ID.
-
Trafficker/Ad Ops: Filter based on the person or team managing the deals.
-
Sales Person: Filter the report based on the sales personnel responsible.
-
Date Range: Select the desired time period for which you want to run the report, such as custom dates, last 1 day, last 7 days, last 14 days or last 30 days.
Filter Report
Note:Deal ID filtering supports both Marketplace Deal ID and External Deal ID.
Note:If Custom Dates is selected, a calendar view will appear allowing you to define specific start and end dates.
Key Metric
The below key performance indicators provide a snapshot of your deal performance.
- Spend/Revenue: Displays the total amount spent or revenue generated over the selected period.
- eCPM: Displays the eCPM value based on the selected data.
- Impressions: Shows the number of impressions served during the specified timeframe.
- Win Rate: Indicates the percentage of wins in relation to the total bids.
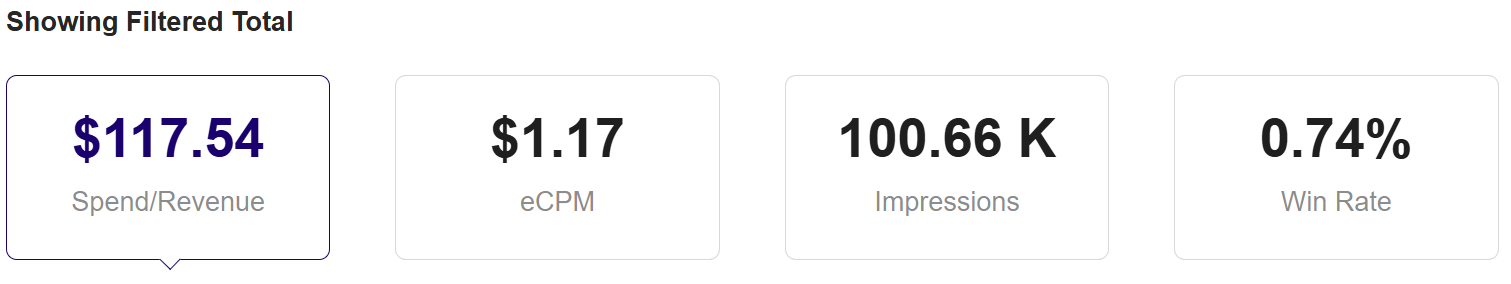
Show Filtered Total
Note:When you first land on the Reporting page, no filters are applied. You’ll see metrics for all deals under your buyer account.
Visualization
This graph displays the Spend/Revenue over the chosen date range. It helps you to visualize the trend and changes over time.
- Hover over the graph to see specific values for Spend/Revenue on different days.
- The graph is updated dynamically based on the filters applied.
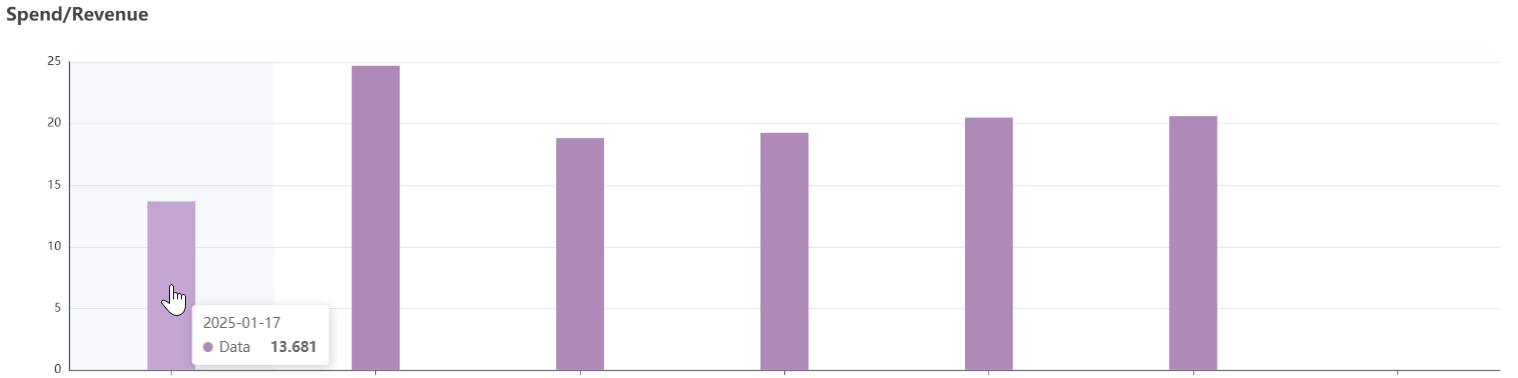
Graph Spend Revenue
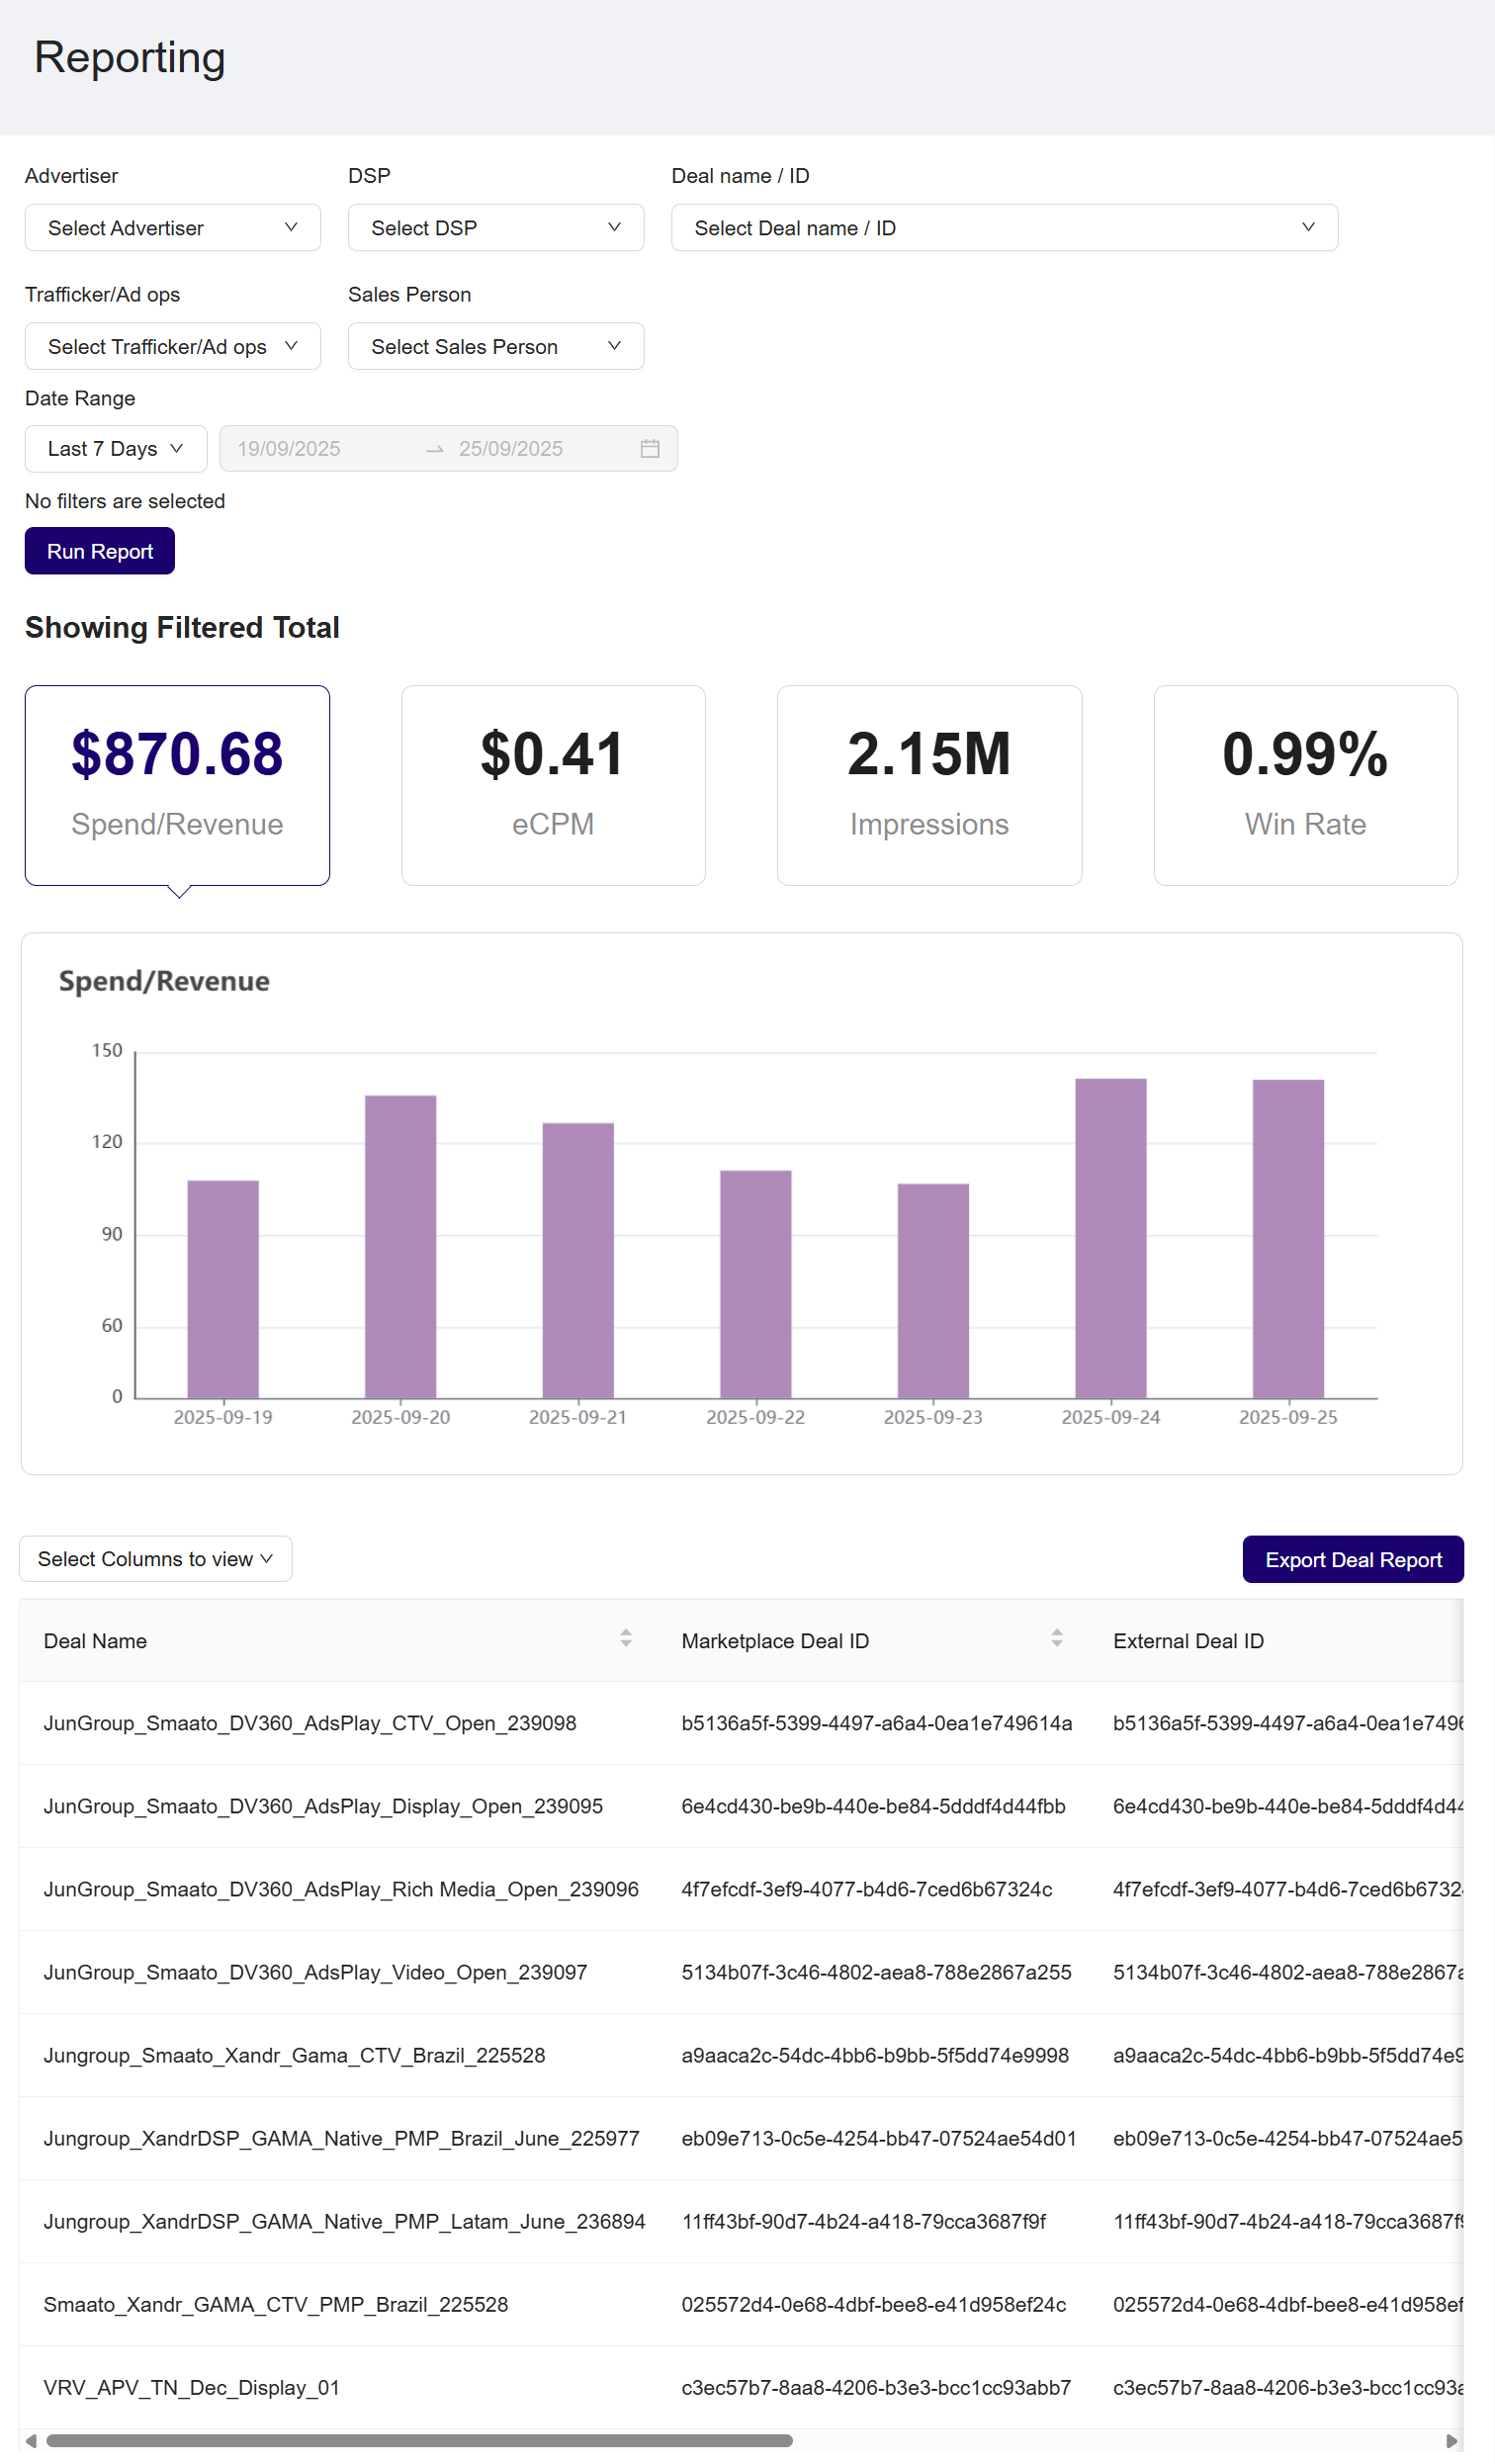
View Deal Column
The data table below the graph presents a detailed breakdown of the filtered report. The key columns include:
| Column | Description |
|---|---|
| Deal Name | The name of the deal. |
| Marketplace Deal ID | The unique identifier assigned to the deal within the Deal Portal marketplace. This ID is generated by the system when a deal is created. |
| External Deal ID | The identifier provided by the DSP or external system for referencing the deal outside of the Deal Portal. |
| Deal Type | Specifies the type of the deal (for example Open Deal). |
| DSP | Displays the DSP associated with the deal. |
| Advertiser | Displays the name of the advertiser associated with the campaign |
| Seat Name | Indicates the seat ID (for example 3103) for the campaign, representing the specific account or seat within the platform |
| Start Date | The starting date of the deal. |
| End Date | The ending date of the deal. |
| Status | Shows the current status of the deal. |
| Impressions | This column shows the total number of impressions served during the deal. |
| Bid Requests | Indicates the number of bid requests made during the deal. |
| Bids | Displays the total number of bids made in the deal. |
| Bid Rate | Shows the rate at which bids were made during the deal. |
| Win Rate | Represents the percentage of successful bids to the total bids. |
| eCPM | Represents the effective cost per mile. |
| Spend | The amount spent in the deal. |
| Trafficker/ad ops | The personnel or team responsible for managing the traffic or operations for the campaign. |
| Salesperson | Indicates the salesperson associated with the deal. |
| Created By | Displays who created or initiated the deal. |
You can scroll through the table to view more data. The pagination controls allow you to navigate through multiple pages if there are many records.

View Deal Detail
Example:If you show 50 rows per page and want to view or export row 52, navigate to page 2 to view it.
Prerequisite
Before running a deal report, ensure the following requirements are met:
- You are logged into the Deal Portal.
👉 See Logging into the Portal - Deal must be in Running or Active state.
👉 See Running a Deal
Accessing the Reporting page
- In the left-hand menu of the Dashboard page, click the
 icon.
icon.
Deal Reporting Workflow
To generate report for the deal, follow these steps:
- When you first land on the Reporting page, no filters are applied. The page will display aggregated metrics for all deals under your buyer account by default.
View Default Report
-
Apply Filters
-
Begin by selecting the desired filters at the top of the page:
-
Advertiser: From the Advertiser dropdown, select the advertiser name you want to view the data or use the search box to set your filter.
-
DSP: From the DSP dropdown, select the Demand-Side Platform (DSP) associated with your report or use the search box to set your filter.
-
Deal Name/ID: From the Deal name/ID dropdown, select the deal name or deal ID to focus on a specific deal or use the search box to set your filter. You can enter either a Marketplace Deal ID or an External Deal ID - both are supported. The system will automatically match and return deals based on the ID you provide.
-
Trafficker/Ad ops: From the Trafficker/Ad ops dropdown, select the relevant traffic or ad operations team or use the search box to set your filter.
-
Sales Person: From the Sales Person dropdown , select the sales person or use the search boxes to set your filter.
-
Date Range: Use the Date Range dropdown to select from preset options (e.g., Last 7 Days), or choose Custom Dates.
Apply filter
-
If you choose the Custom Dates, a calendar picker allows you to choose a custom start and end date
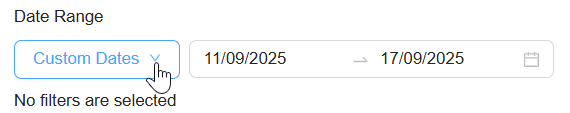
Select custom dates
-
-
-
-
Your selected filters will appear as tags below the filter bar.
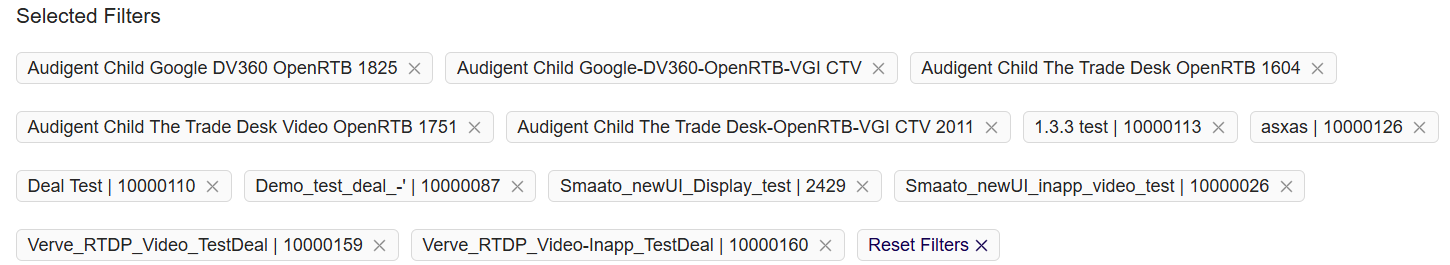
Selected Filter
- To remove a single filter, click the x icon next to the selected tag.

Removed selected filter
- To clear all selected filters, click Reset Filters.
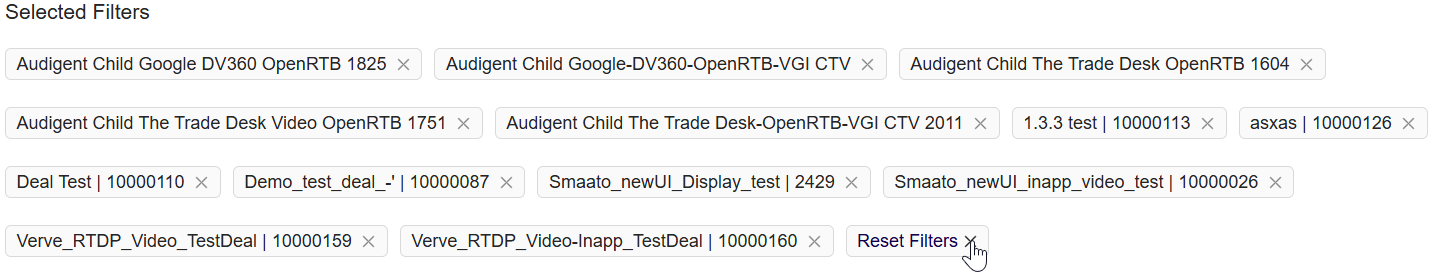
Reset selected Filters
- Click the Run Report button to generate the deal performance metrics based on applied filters.
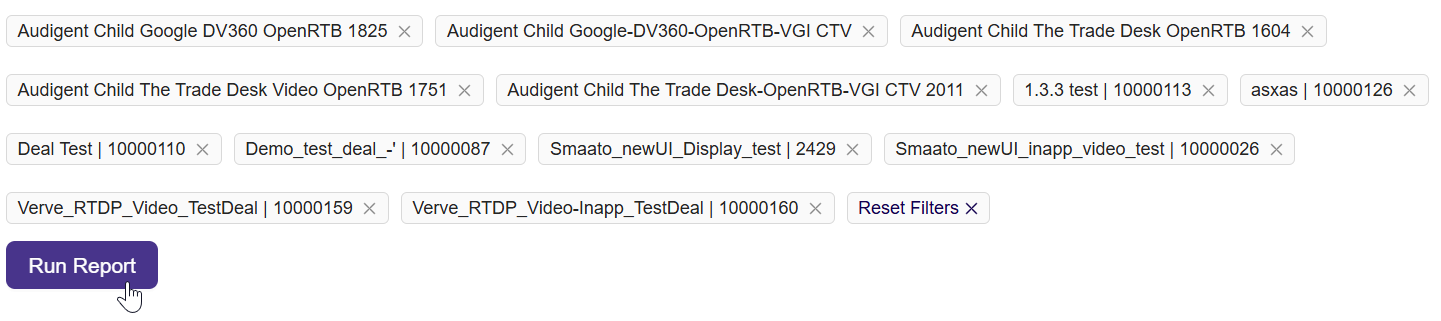
Run report
-
The top section displays key metrics. see the Figure: Showing Filtered Total
- Spend/Revenue: Total spend or revenue.
- eCPM: Effective Cost Per Mille (cost per 1,000 impressions).
- Impressions: Total number of ad impressions.
- Win Rate: Percentage of successful ad bids.
-
The Spend/Revenue graph visualizes day-wise revenue trends. Hover over bars for daily values, see the Figure: Graph Spend Revenue
-
Click Select Columns to view and choose which columns to display in the deal table. For column description, see the View Deal Column.
Select Columns to View
-
Scroll down to view detailed deal metrics. Use pagination to move between pages. See Figure View Deal Details
-
Click the Export Deal Report button to download the data in csv format for offline analysis.
-
The preview of deal report in csv format appears as below:
Deal Report
Note:The export includes all filtered deals - not just those on the current page.